Introduction
From early 2017 to early 2021, the US Census gained a fair amount of news coverage. Both political parties seemed determined to control everything from questions on citizenship to language on gender and ethnicity. Though this remained a persistent argument during this time, the issue of potentially damaging census results was something neither party desired. This worry is due to one somewhat startling point: almost all major public and private decisions made in the US use this geographic data collection.
Whether you are a politician hoping to gain more votes through redistricting or a business planning on the most profitable location to build a store, the US Census is a crucial data set for your analysis. This diversity of use for census data demands a high level of accuracy and reliability. As a result, the US Census Bureau takes extreme care to collect, process, analyze, and deliver the data.
I'm surprised I haven't done anything on census data, given my background. However, I think it's well overdue with a new decennial census and changes to census data access.
This post is the first of a multi-part blog series on census data, going through understanding and accessing US census data to analyze it for real-world impact. So let's get into it!
What is Census Data?
A census is the collection of information about every member of a population. In the US, this data collection includes age, gender, ethnicity, and household income, representing people at varying scales, from the national to the block level. The census also includes Native American areas and US territories.
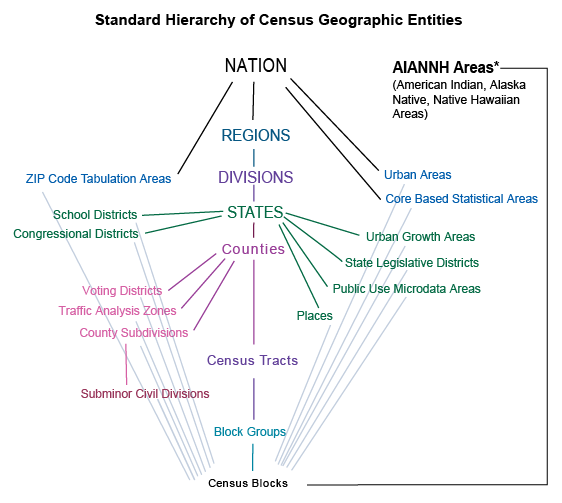 US Census Hierarchy
The US Census, in particular, is collected in a few different ways. The first and most notable is the decennial census collected every ten years. The Census Bureau conducts community surveys every one, three, and five years between decennial census periods, capturing different types of estimates.
A national census is critical as governments use it to plan public services, emergency planning, and redefine voting districts, to name a few use cases. The private sector uses the census for marketing and business planning, estimating real estate, retail management, calculating insurance rates, financial planning, and more. This process is especially true in metropolitan (e.g., more densely populated) and micropolitan (e.g., more sparsely populated) urban areas.
For more information on the census, I urge you to visit the US Census Bureau website, which contains volumes of valuable and essential information. However, there is one crucial element about the data we need to discuss: geographic identifiers.
GEOID
The US Census data encompasses several data engineering factors: complex schema covering several dimensions; varying scales of geographic information within a strict hierarchy; connection to other data collections using varying data types. Geographic identifiers (GEOIDs) are unique numeric codes used to track dimensional measures across varying scales within the census. The codes are also the connective fabric between the census and other supplementary data such as TIGER, ANSI, DoE, and USGS data products.
Specific to the US Census data we'll be using, the block code 482012231001050 follows this hierarchical pattern:
- 48 for the state
- 201 for the county
- 223100 for the census tract
- 1 for the block group
- 050 for the block
There are variations to this such as places, but these changes are identifiable in the schema for place data. The US Census data explorer helps you select and identify the GEOID structures when you search for and download the data (often captured in a metadata file).
And with that, let's go grab some data!
Accessing Data
There are several ways to access census data. For GIS or data analysis professionals, the traditional way to access this data is to download flat files. This can be done through the census website or more directly through a FTP site. With the updates to the census data website, I would recommend that option due to the advanced query feature that will allow you to download just the fields and scale of data you need for your analysis. The US Census Bureau also provides a direct API option if you require persistent automated access to the data for more advanced data modeling.
Let's start with the old-fashion way.
Metadata and Documentation
Whoa! Pump the brakes. Before you go ahead with downloading data, let's make sure you're downloading the correct data for your research! This requires reading a good amount of documentation and reviewing metadata for the appropriately identified data sets (a literature review may also help accelerate this process… just saying :D ).
The US Census maintains large amounts of data and much larger amounts of documentation. This documentation is the most critical reason why the data is one of the richest and well-maintained collections in the world. The metadata and data dictionaries make using this data for research simple as it's provenance and legacy can be cross-validated and cross-referenced by multiple parties. The decennial census and American Community Surveys are the most commonly referenced, but there are dozens of direct and derived data sets for topic from economics to education and incarceration. Before attempting any research with census data, you should thoroughly read the documentation for the survey and/or program data you have selected.
Downloading Data
For traditional GIS analysts using ESRI or QGIS, this is perhaps the most common path to access and download census data (this may even be true for data analysts and data scientists). We start by using the Census Data Explorer.
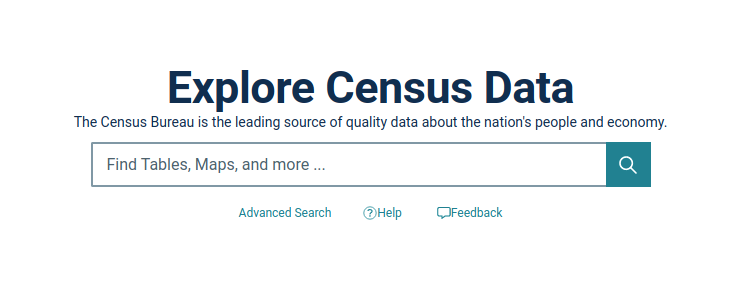 US Census Data Explorer
This is a great website that helps you understand the available data and the Census Bureau's supporting utilities. You'll want to click on Advanced Search underneath the search box as this is the real power of their explorer.
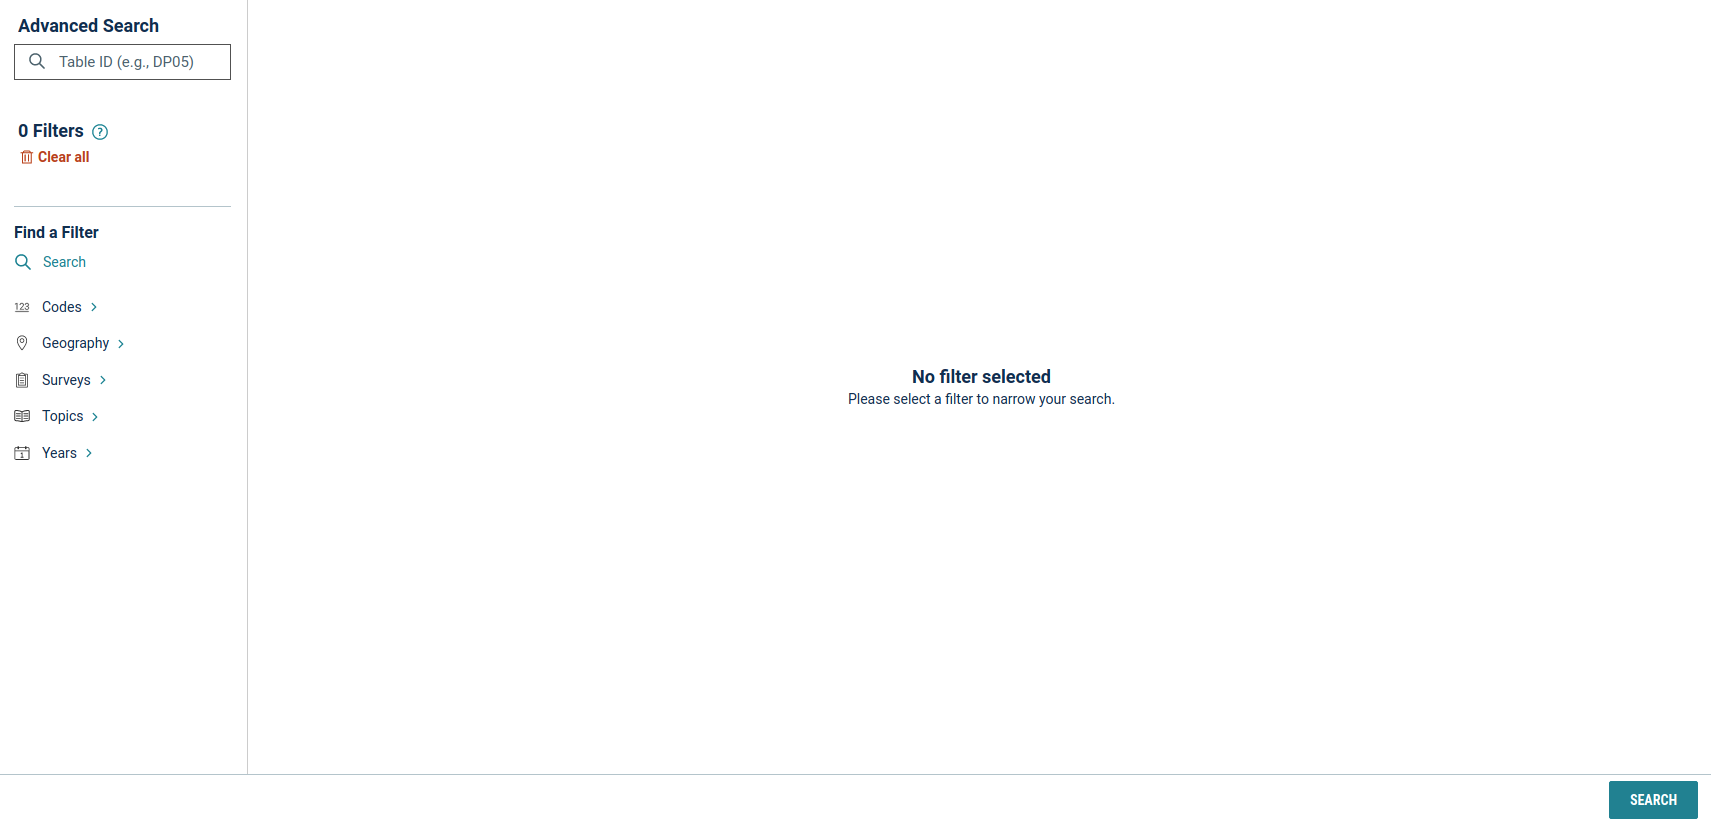 US Census Advanced Data Search
Once in this interface, you'll notice the filters on the left side.
Codesallow you can search for relevant data based on specific code systems such as NAICS, NAPCS, EEO, and others.Geographyallows you to select the scale(s) of data for your analysis.Surveysallow you to select more specific data associated with redistricting and demographics.Topicsallows you to focus on a category of data (which is only vacancy related for me).Yearsallows you to define the temporal dimension for your data query.
So let's grab some census data for analysis. Let's add a 2020 filter from Year, add All Counties within Florida from Geography, and click Search in the lower right corner.
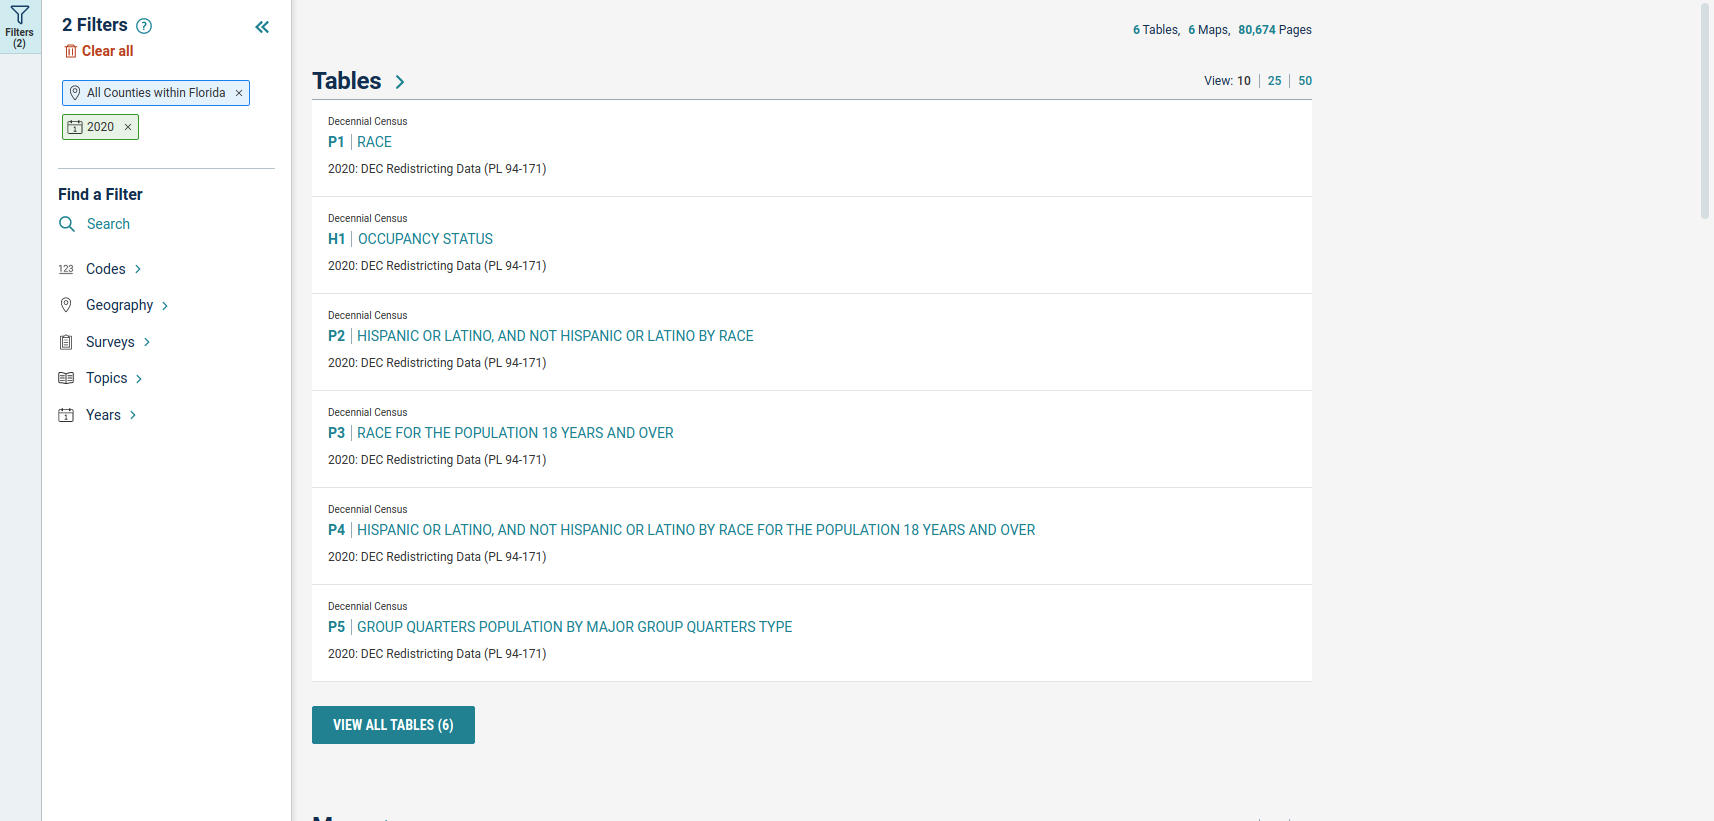 2020 Florida Counties Search Results
You should see something like the image above. The explorer allows you to add or modify the filter to better refine your search results. Let's select the H1 | OCCUPANCY STATUS table.
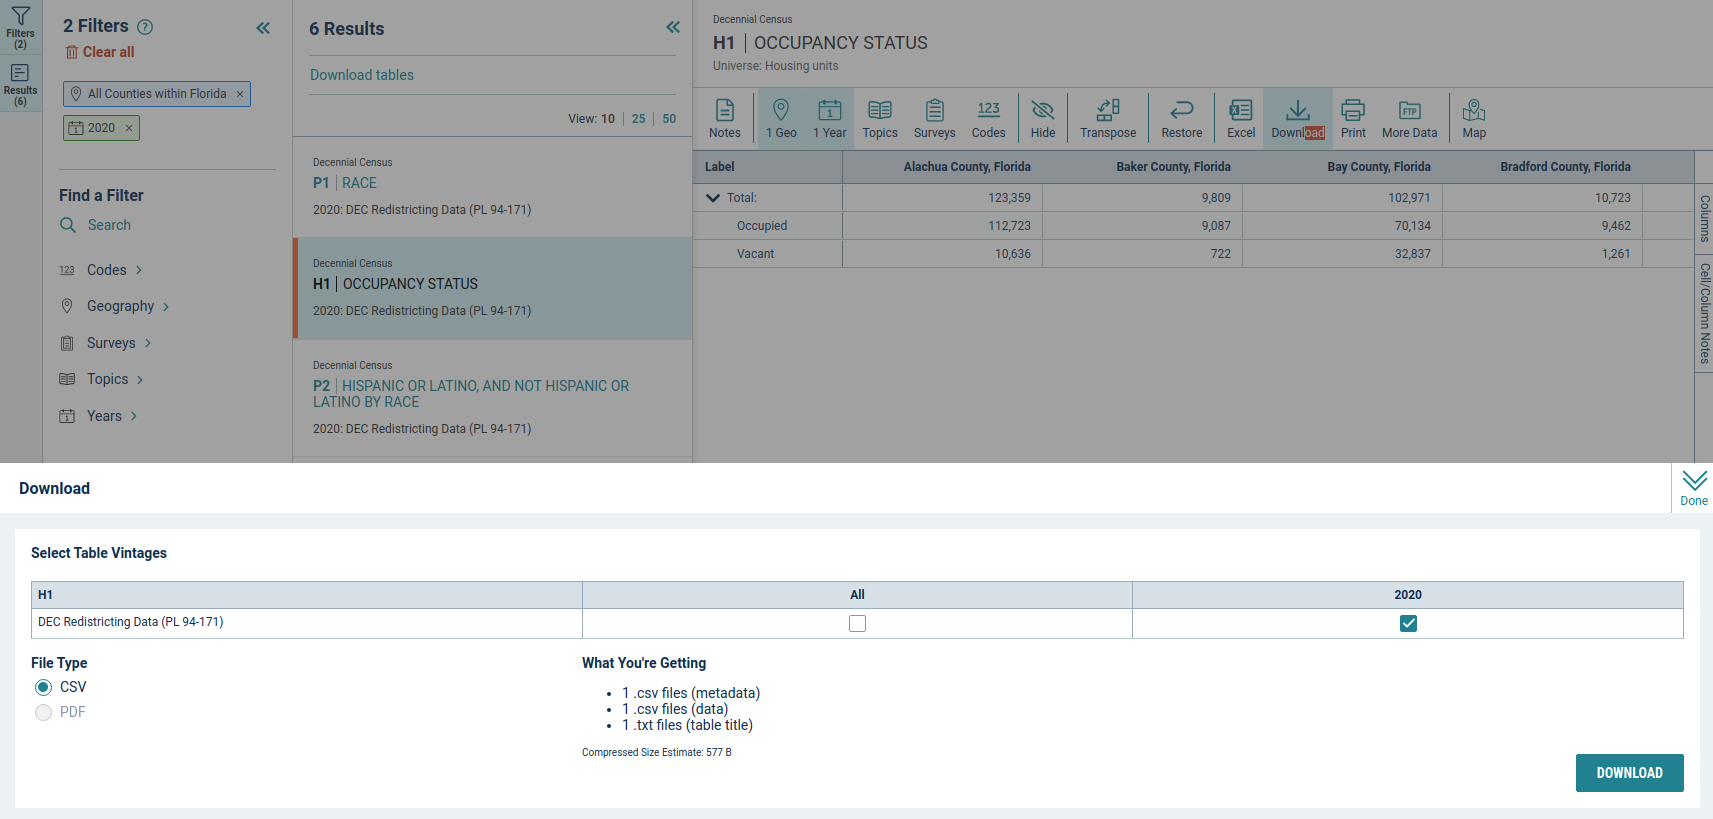 2020 Florida Counties H1 Occupancy Download
By selecting the table from the list, you will see a table sample appear with schema and values. There are several tools you can use with this table including additional filters, search, table transpose, data export, data download, and the option to visit the FTP site to search additional raw data holdings. Let's select the Download option and select the Download button in the lower right corner.

A pop-up will show the export preparation and finally a signal to DOWNLOAD NOW. Save the zip file to a location of your choosing. Let's repeat this download process for the P1 | RACE table.
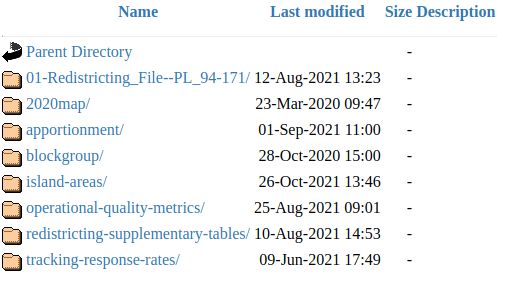 US Census Data FTP
If you require additional information or require a complete download of multi-year, multi-code, multi-scale data, the FTP site (shown above) has the raw data holding as well as the readme materials for the census data collections.
Application Programming interface
The US Census Bureau provides programmatic access to their data via a number of RESTful application programming interfaces (APIs). These APIs and their documentation are available via their developer page. On this page, there is a link to Request a KEY which you'll need to complete any request to their APIs. Enter your organization name, email address, agree to their terms of service, and click submit. You should receive an email with your key which we'll use in the next section of this post.
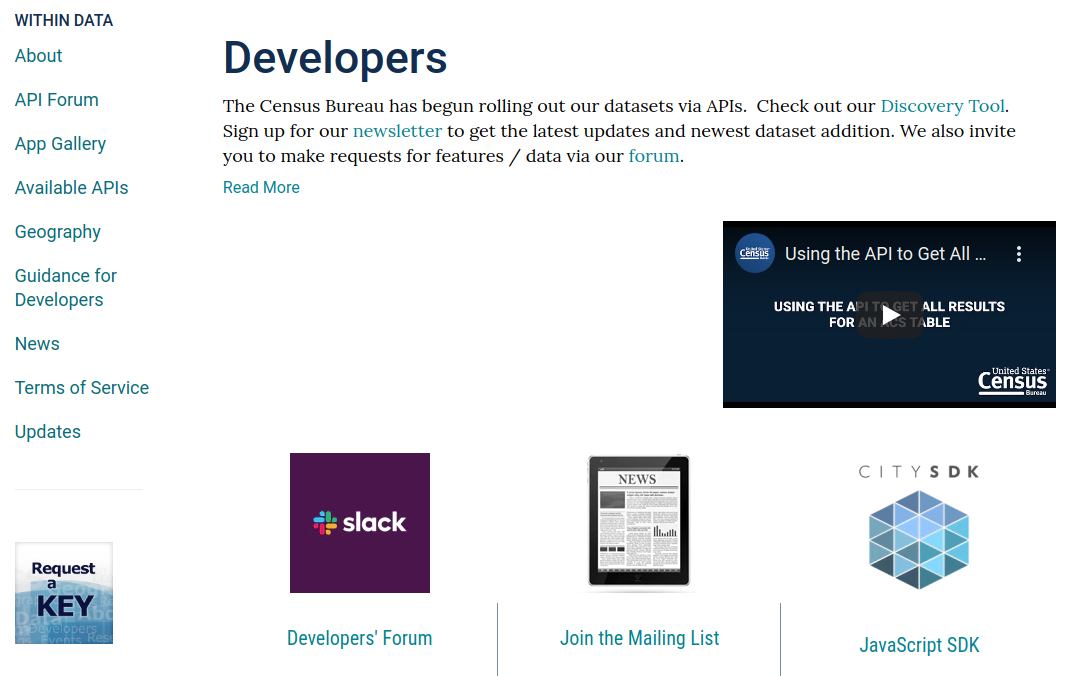 US Census Data for Developers
There are many APIs available which you can view by scrolling down and selecting the VIEW ALL AVAILABLE APIS button.
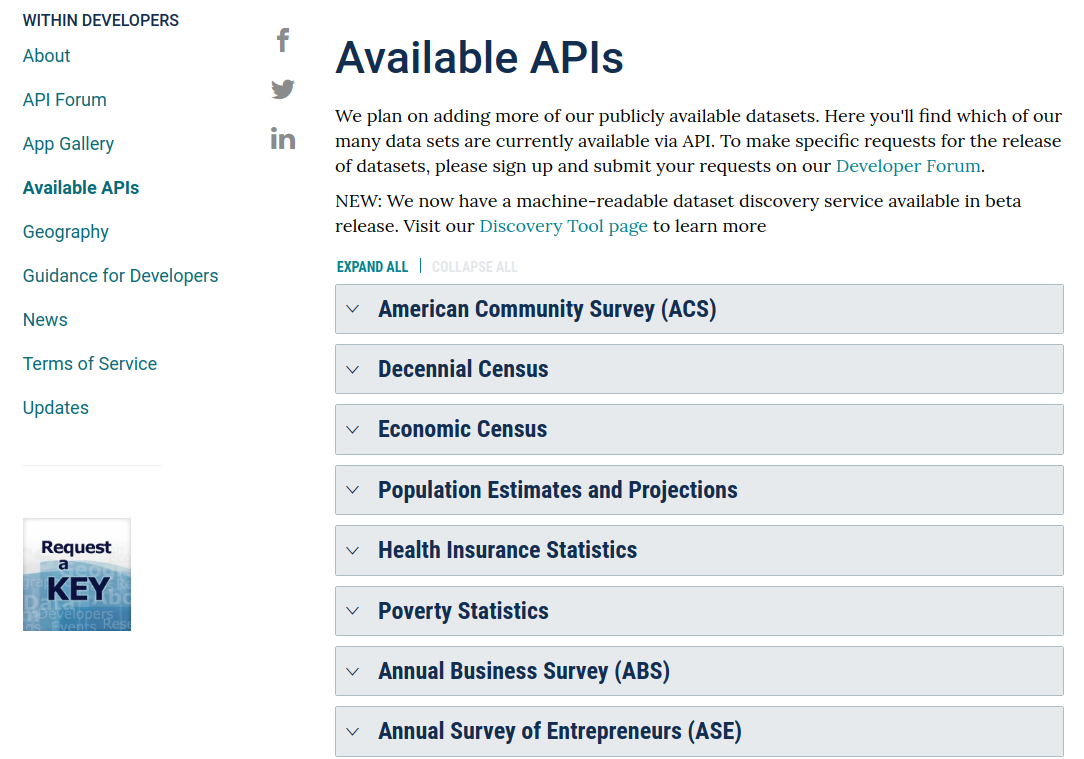 US Census Data API list
Once you're in the Available API list above, we can explore all the data available to us. This includes the decennial census data for 2020 that we downloaded from the explorer. Select the Decennial Census and then Decennial Census (2020, 2010, 2000) from the list.
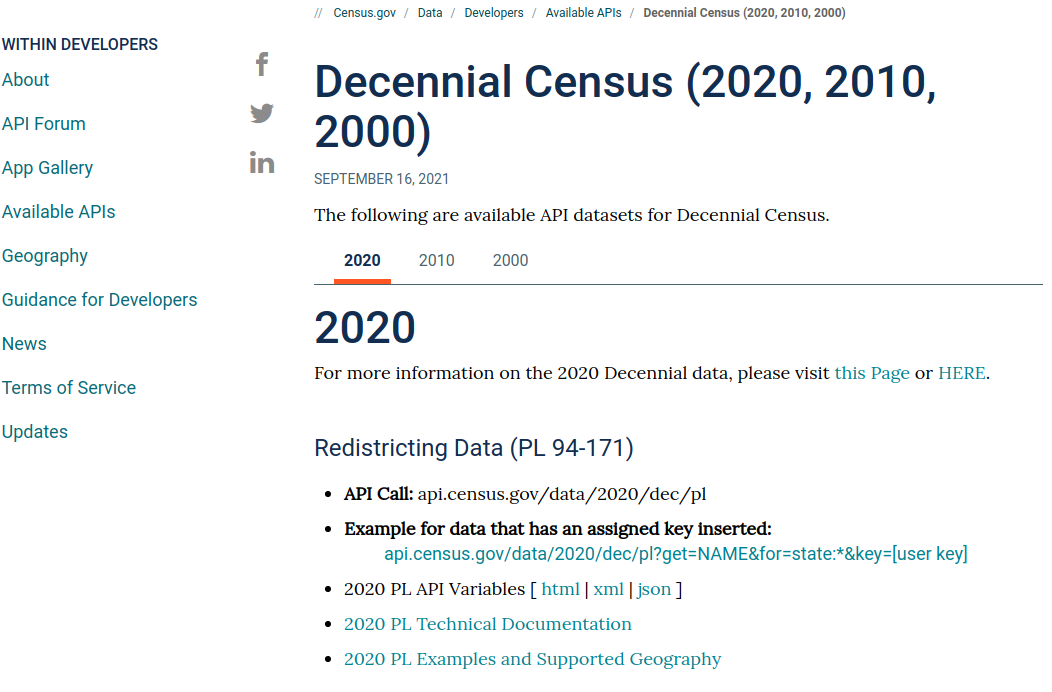 US Census Data API - Decennial Census
Once on the API page for the Decennial Census data, you can explore the query variables, technical documentation for the API, and sample queries for the data you require. Select the 2020 PL Examples and Supported Geography link. This will give you a simplified, consolidated view of the RESTful interface and how to tailor it to extract the data you need.
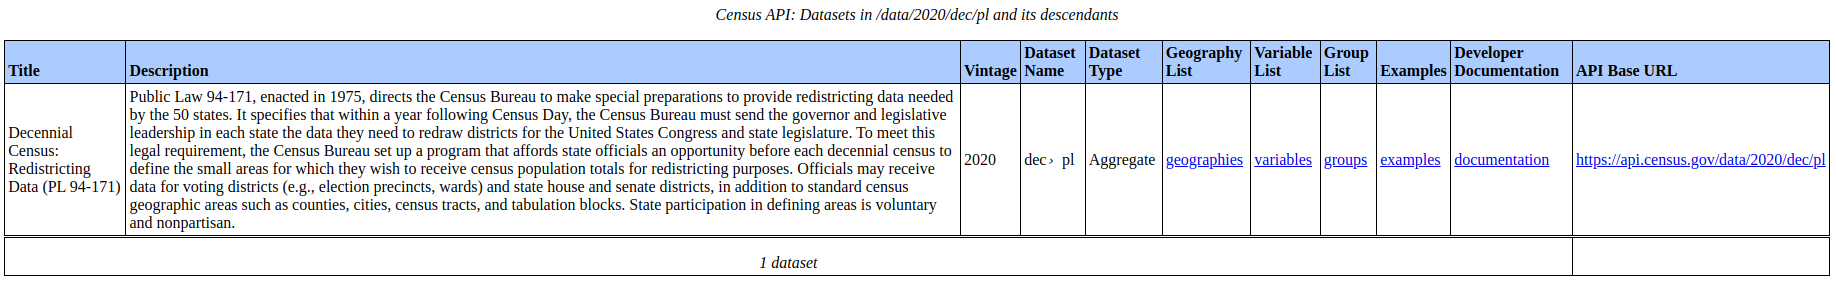 US Census Data API - 2020 Decennial Census API Documentation
We'll use this later when we're extracting and examining our data. However, we still need some additional data because of course you do. :D
Spatial Layers
As mentioned above, the GEOID is the manner in which census data is combined with other data collection for more complex forms of analysis. One such data set are the spatial layers files used to join census data to their scales of geographic area. These mapping files can be used in traditional geographic information systems like QGIS or ESRI software and in more modern web applications such Mapbox. This utilization allows for more complex analysis of spatial patterns found in the census data.
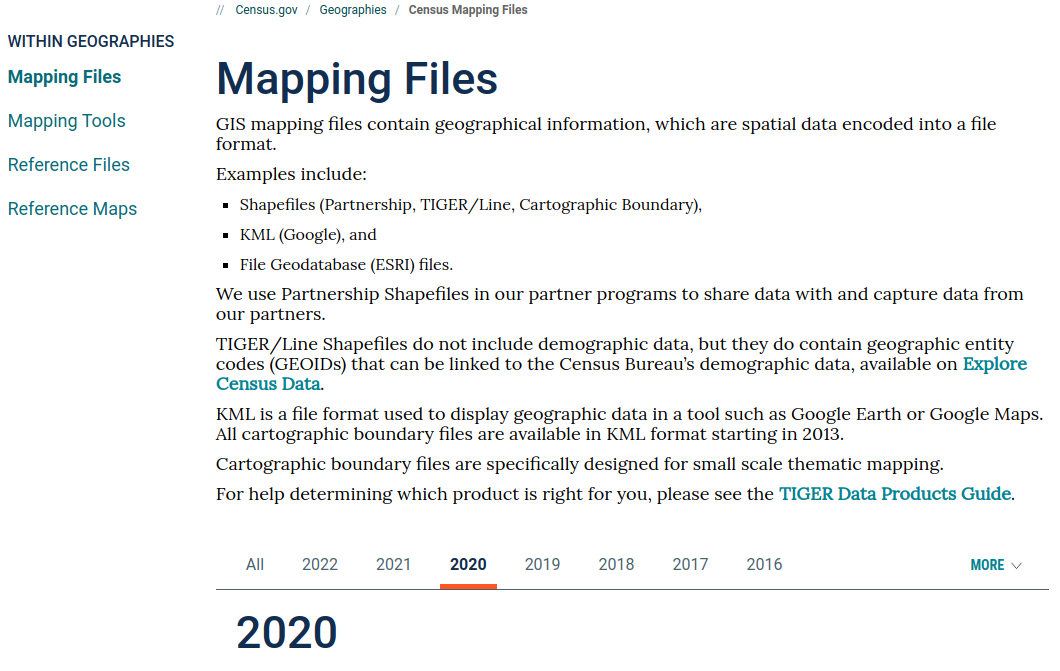 US Census - Mapping Data
Shapefiles, KML, and geodatabases are available for download. It is important to select the correct year for the census data you have downloads. This year matching ensures that the number of records in census data match the number of spatial areas with the same GEOID in the spatial layers. Select 2020 from the years listed and then select TIGER/Line Shapefiles.
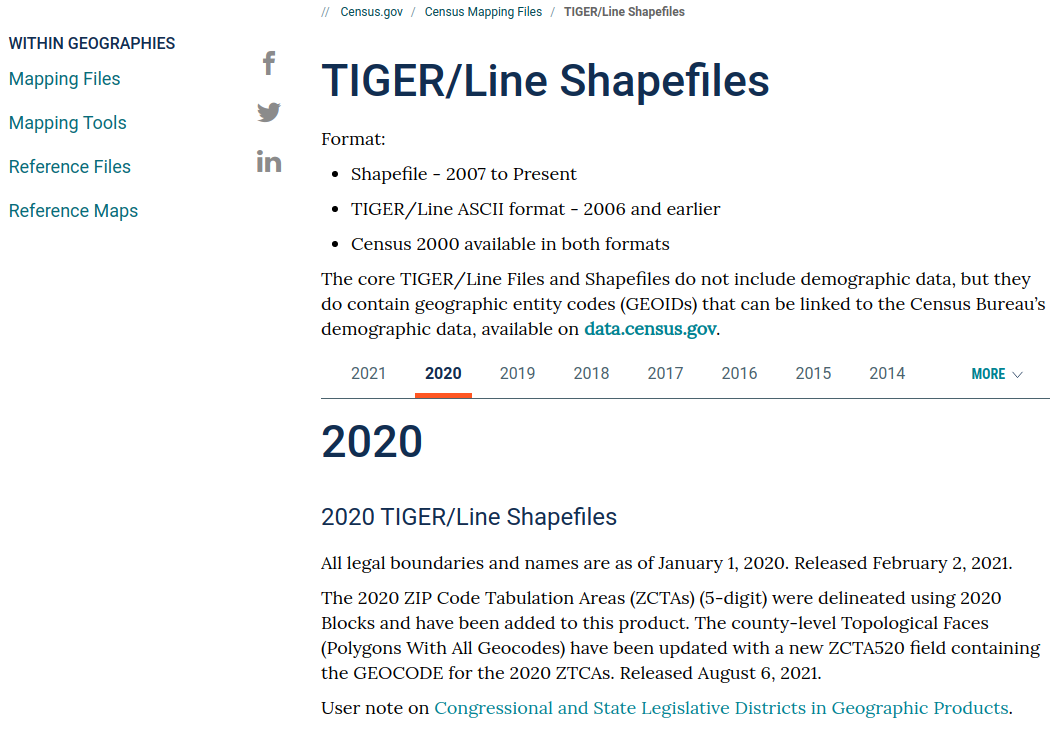 US Census - TIGER Files
TIGER files are the legal boundaries established per census year. You can download these files via web interface or FTP, but we'll opt for FTP so we can examine the TIGER data collection. Once on the TIGER page, select 2020 for the year and scroll down to select FTP Archive by State.
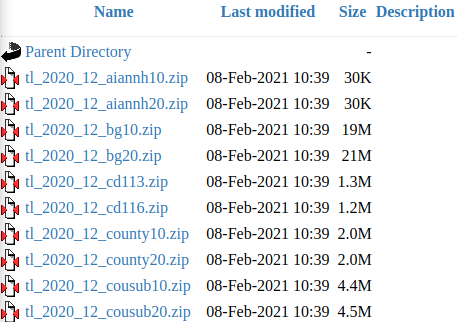 US Census - TIGER FTP
Once in the FTP site, select 12_FLORIDA, then 12 for all counties, and then tl_2020_12_county20.zip to download the TIGER data for Florida counties.
With the access to census data and spatial data layers, we're now ready for some exploratory data analysis.
Extracting Census Data
Now that we've had a brief introduction to the census data, we're now ready to load our data and take a quick look at it. There are several ways to do this, so we'll start with the traditional route of using GIS software and then move to more programmatic data processes.
GIS software such as QGIS can be extremely useful for initial and exploratory data analysis. Using QGIS, we can load the H1 census data as a table without geometry information, load our TIGER data for Florida counties, and perform a join on the GEOID in each file to produce a choropleth map of 2020 Housing Occupancy Totals. QGIS also comes with tools for refined map creation, spatial statistical analysis, and geovisualization through a number of plugins.
 US Census - QGIS Preview for 2020 H1 - Totals Data
The US Census has much more data than the H1 data set we visualized above and downloading this data across the entire country and across census years for multi-scalar and longitudinal analysis may prove extremely difficult and time consuming. This challenge is where use of APIs and programming languages may be a superior solution for automating and accelerating what is traditionally a very manual and tedious process.
The US Census does provide some packaged solutions for this, making Microsoft Access, SAS, and R scripts available through their legacy developer tools. GitHub also contains several projects to assist in processing and analysis of census data. We’re going to be using Python for the remainder of Part 1 and for Part 2.
If you downloaded the data from explorer in CSV format, loading it is as simple as using Pandas or GeoPandas to created a dataframes with the CSV file.
import pandas as pd

h1_ex_df = pd.read_csv('data/DECENNIALPL2020.H1_data_with_overlays_2022-01-15T201832.csv')
h1_ex_df = h1_ex_df.drop([0])
h1_ex_df.head()
Use of the API will require a bit more work. First, you'll need your API key. Then you will need to examine the documentation to ensure your RESTful query will produce the data output you need for your analysis. This will require knowing variable like the year, the data element, and the geographic scale of the data.
We're going to use the API to recreated what we exported from the data explorer above.
import requests
import pandas as pd

api_key = 'your API key'

data_elements = ['GEO_ID', 'H1_001N', 'H1_002N', 'H1_003N']
geo_scale = 'for=county:*&in=state:12'

def decennial_api_etl(year, element, geo_scale, api_key):
    api_data = requests.get(f"https://api.census.gov/data/{year}/dec/pl?get={element}&{geo_scale}&key={api_key}")
    df = pd.read_json(api_data.text)
    df.columns = df.iloc[0]
    df = df.drop([0])
    df = df.drop(columns=['state'])
    return df

combined = decennial_api_etl('2020', 'NAME', geo_scale, api_key)
combined = combined.drop(columns=['NAME'])

for i in data_elements:
    df = decennial_api_etl('2020', i, geo_scale, api_key)
    combined = pd.merge(combined, df, on='county')

combined.head()
So let's walkthrough the insanity you see above:
- Import requests to interact with the RESTful API and Pandas to load and transform the data
- Create a variable for the API key
- Create a variable containing a list of API element we want to download
- Create a variable for the geography scale of the data (in this case we're looking at Florida counties)
- Define a function
decennial_api_etlto create a reusable chunk of code to:- Get the JSON from the API
- Requests uses the
getmethod to send a string to the API - Use
f-stringreplacements for the year, element, geo_scale, and api_key arguments
- Requests uses the
- Use Pandas to read JSON into a DataFrame
- Assign column names using the first row
- Drop the now duplicate header row
- Drop an unnecessary column
state - Return the transformed DataFrame from the function
- Get the JSON from the API
- Define a dataframe variable
combinedcontaining theNAMEAPI data using thedecennial_api_etlfunction - Drop the
NAMEcolumn from thecombineddataframe - Iterate through the
data_elementslist: - For each element in the list, load it into a dataframe
df - Merge
dfwithcombinedon thecountyfield
A more Pythonic way (add the preferred way) to bring the JSON data into a dataframe would be df = pd.DataFrame(api_data.json()[1:], columns=api_data.json()[0]). However, I've expanded this consolidated process into simpler dataframe commands to illustrate the ETL process going into the dataframe merge loop.
Once the data is loaded, we're ready for exploratory data analysis which we'll pick up in Part 2!
Wrapping Up
The importance of cross-validated and openly-available national census data cannot be understated: it is an essential collection critical in almost all government operations and industry analytic requirements. It is also important for citizens to know this data is available for them and is extremely useful for themselves and their communities. Due to the scrutiny placed on this data and the numerous research projects conducted with it, census data makes for excellent training data for data analysts, data scientists, and data engineers.
In Part 2, we'll perform exploratory data analysis with our census data: using this analysis to conceive a research project.
References
US Census Bureau
FiveThirtyEight
Missouri Census Data Center
This work is licensed under a Creative Commons Attribution-NonCommercial-ShareAlike 4.0 International License.