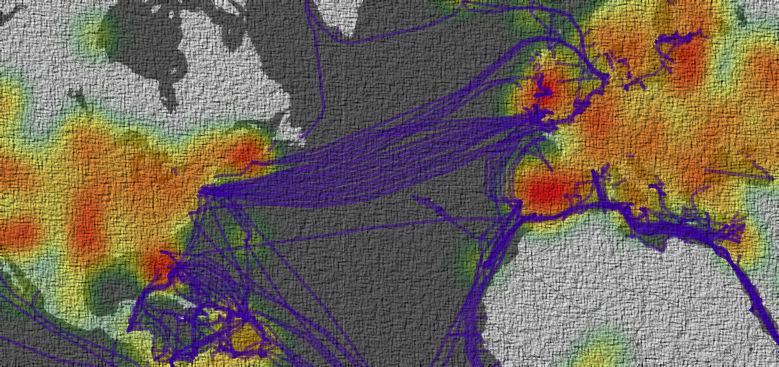
I recently completed a short data journalism piece on Bitcoin and the spatial aspects of accessibility to that cryptocurrency network (using known mining node locations). I then compared this to known (yet artistically altered) locations of information and communication infrastructure which facilitate high-speed Internet.
I used D3.js and Scrollama for the initial concept section of the article. I then used Leaflet for the more detailed interactive map. I used Python with Jupyter Lab to parse and prepare my data.
Check out the final product here (source code for the project can be found on my GitHub)!

This work is licensed under a Creative Commons Attribution-NonCommercial-ShareAlike 4.0 International License.